Pages

Showing posts with label Conservation. Show all posts

Wednesday, November 6, 2019

Climate Change and the future | Conservation/Sustainability

Aim; To look at the different ways we can prevent climate change in the future.


What places will be effected?

The pacific islands

What else do we need to think about?

Places near rivers, homes near rivers, 

What other places around NZ will be affected?

Timaru, Auckland, Wellington, Napier, Whakatane, Tauranga, Nelson and Gisborne.

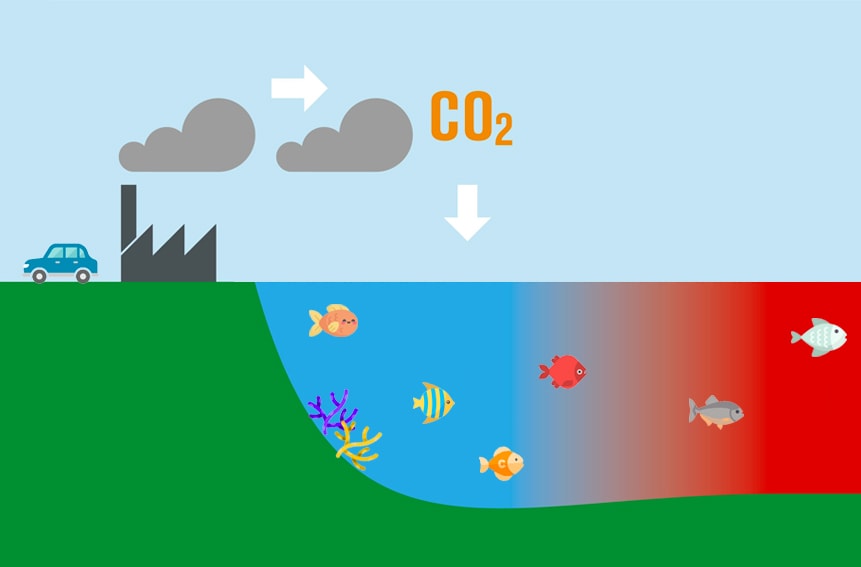
What does this do to our drinking water?

Saltwater goes into people's homes, which will be bad for their health and people will be sick.

What are the main concerns?

Saltwater will get into people's drinking water. 

What can we do?

  1. Using public transport 
  2. Buying a hybrid/electric cars
  3. Build a house try not to use lots of energy.

What is the one, silver bullet solution?

There is no silver bullet

What is the mix of things we need to start doing?
  1. Getting to be able to use renewable 
  2. Solar heating
  3. Transport
What are 3 others you can think of?
  1. Recycling 
  2. Cycling
  3. Reusing items (plastic bags, plastic objects, things which might not be used, etc.)  
Activities:

Carbon Footprint

Carbon Footprint explained

Dwelling
Water
Recreation
Heating and cooling
Electricity
Transportation
Food
Waste
Air Travel
Consumption

Colour 1: for actions, they are already doing 
Colour 2: for actions that they pledge to undertake in the future

Ecological Handprint The Ecological handprint builds on the concepts from the Carbon Footprint. We will look at the positive actions of:
  1. Transportation
  2. Community
  3. Consumption
  4. Water
  5. Food
  6. Home
  7. Waste


1 Colour: For each action, you are already doing 
2 Colour: For each action, you would like to do in the future


    List 5 of the actions you pledge to do in the future.

    1.   I'll compost
    2.   Have a programmable thermostat
    3.   I'll garden
    4.   I will have a rain barrel
    5.   I will stand up with important issues.

    Monday, October 28, 2019

    Renewable Energy | Conservation/Sustainability

    Aim: To make a solar powered oven.
    Materials: 

    1. Sellotape
    2. Scissors
    3. Pizza Box
    4. Straw
    5. Marshmallow
    6. Biscuit
    7. Glad wrap
    8. Tinfoil
    9. Black plastic
    10. Ruler
    11. Vivid marker (pen)
    12. Newspaper
    Steps:
    1. Cut out the flap on the lid of the pizza box so that it is 5cm around the edge.
    2. Sellotape some tinfoil on the inside of the flap.
    3. Sellotape some glad wrap so that the hole you have to cut on the pizza box lid is covered over with glad wrap.
    4. Put a piece of black plastic on the bottom of inside of the pizza box on the bottom.
    5. Make a paper square out of newspaper that fits inside the pizza box and lays around the edge.
    6. Put a marshmallow on top of a chocolate biscuit, place it on a plastic plate and put it on the solar oven.
    7. Put it in the sun to cook.


    Conclusion

    The smores weren't cooked because there was no sun near the oven. The positive thing was that heat couldn't get out of the oven because everything is perfectly fitted.


    Aim: To make a presentation that investigates different renewable energy's.

    Section 1: Title Page

    Make a title page that incorporates all renewable energy 's Hydro, Solar, Wind and Wave.


    Section 2: Definitions

    Define and provide a picture of each energy type.

    1. Hydro Energy - energy created from the movement of the water, eg. Dams.
    2. Solar Energy - energy from the sun, eg. Solar Panels.
    3. Wind Energy - is a process by which wind is used to generate energy, eg. Windmills, wind turbines.
    4. Wave Energy - is produced by up and down motion of floating devices placed on the surface of the ocean.
    Section 3; Investigate each of the 4 Energy types.
    (Hydro, Solar, Wind, Wave ) 


    Hydro

    1. Type: Hydro
    2. Is it used in NZ? Yes, it accounts for 57% of the total electricity generation in New Zealand. Link
    3. Other Countries that use it? Yes, Brazil, Canada, Norway, Paraguay, Austria, Switzerland, Venezuela, and more countries use hydroelectricity.
    4. How is it used to generate electricity? The energy created from the movement of the water.
    5. Draw and label a diagram of the main parts of the electricity generator? This can be done on paper and uploaded or on a drawing program on your device. I do not want any Internet images or pictures. They must be hand drawn using a ruler and labelled.


    Solar


    1. Type: Solar
    2. Is it used in NZ? Yes (solar)
    3. Other Countries that use it? Germany, Italy, Spain, Japan, United States, Czech Republic and more.
    4. How is it used to generate electricity? It is from the energy from the sun.
    5. Draw and label a diagram of the main parts of the electricity generator? This can be done on paper and uploaded or on a drawing program on your device. I do not want any Internet images or pictures. They must be hand drawn using a ruler and labelled.


    Wind


    1. Type: Wind
    2. Is it used in NZ? Yes, New Zealand has a total of 19 wind farms (operating or under construction).
    3. Other Countries that use it? China, India, Spain, the United Kingdom, France, Brazil and more countries use wind energy.
    4. How is it used to generate electricity? Wind energy is a process by which wind is used to generate energy,
    5. Draw and label a diagram of the main parts of the electricity generator? This can be done on paper and uploaded or on a drawing program on your device. I do not want any Internet images or pictures. They must be hand drawn using a ruler and labelled.


    Wave


    1. Type: Wave
    2. Is it used in NZ? No, there are lots of resources but yet have not generated power from them.
    3. Other Countries that use it? Ghana, United Kingdom, Spain, Portugal, United States, Israel, Greece, Sweden, Scotland, Italy, Russia and more.
    4. How is it used to generate electricity? Wave energy is produced by up and down motion of floating devices placed on the surface of the ocean.
    5. Draw and label a diagram of the main parts of the electricity generator? This can be done on paper and uploaded or on a drawing program on your device. I do not want any Internet images or pictures. They must be hand drawn using a ruler and labelled.


    Section 4: Renewable Energy in the future.

    List 10 ways that renewable energy will be used in the future to replace our current activities.


    1. Cars
    2. Boats
    3. Planes
    4. Petrol Stations
    5. Trains
    6. Chimneys
    7. Batteries
    8. Chargers
    9. Robots
    10. Fossil Fuels

    \


    Friday, October 18, 2019

    Wind Power | Conservation/Sustainability


    Measuring weather.

    Definitions:


    1. Anemometer: Is an instrument which measures the wind.
    2. Beaufort wind scale:


    Anemometer
    MATERIALS
    1. Sellotape
    2. Pencil
    3. 2 pencils
    4. 4 cups
    5. Pin  
    STEPS
    1. Sellotape the sticks to the cups.
    2. Sellotape the sticks together to make a cross.  
    3. Pin the cross to the rubber on the pencil.

    Group Investigation.
    Groups size: 5 
    Roles:
    • Timekeeper
    • Counter
    • Recorder
    • Anemometer Manager
    • Wind Manager
    1. Mount the anemometer in a place that has full access to the wind from all directions.
    2. When the time keeper says "Go", the counter in each group will count how many times the marked cup passes them in one minute and write it down.
    3. Repeat the above step four (4) times and record the number of spins on the chart.
    FINDINGS

    • Record how many times it spins and record it in the table below.
    • You will need to time them and count the number of spins.


    Place name on school grounds                                    Number of Spins in 15 seconds
    1.Field20
    2.Old J Block site15
    3.Grass hill in squad10
    4.Tennis court gate3


    • USING A4 PAPER DRAW YOUR RESULTS ON A GRAPH.
    • TAKE A PICTURE OF THE GRAPH AND UPLOAD IT TO YOUR BLOG
    WHICH IS THE WINDEST AREA AND WHY?WHICH IS THE CALMEST AREA AND WHY?WHERE IS THE BEST PLACE ON LAND TO BUILD A WINDMILL?


    Sorry for the bad quality


    CONCLUSIOn:

    On the field, the Anemometer spun 80 spins per minute. It had a wind speed of 13-20 kph. This speed is 3 on the Beaufort Scale. (Leaves and small twigs in constant motion; wind extends light flag.)


    On the old J Block site, the Anemometer spun 60 spins per minute. It had a wind speed of 13-20 kph. This speed is 3 on the Beaufort Scale.

    On the Grass Hill in the squad, the Anemometer spun 40 spins per minute. It had a wind speed of 2-5 kph. This speed is 1 on the Beaufort Scale. (Shown by direction of wind smoke drift, but not by wind vanes.)

    On the Tennis Court gate, the Anemometer spun 12 spins per minute. It had a wind speed of 2-5 kph. This speed is 1 on the Beaufort Scale.

    According to the data, the most spins on the Anemometer is on the field, with 80 spins per minute and it had a wind speed of 13-20 kph. The least spins on the Anemometer was by the Tennis Court gate, it spun only 12 spins per minute. It had a wind speed of 2-5 kph. 

    Wind


    Beaufort
    Force
    Wind Speed
    (KPH)
    Spins
    Indicators
    Terms Used in NWS Forecasts
    0
    0-2
    0
    Calm; smoke rises vertically.
    Calm
    1
    2-5
    10
    Shown by direction of wind smoke drift, but not by wind vanes.
    Light
    2
    6-12
    40
    Wind felt on face, leaves rustle; ordinary vanes moved by wind.
    Light
    3
    13-20
    80 
    Leaves and small twigs in constant motion; wind extends light flag.
    Gentle
    4
    21-29
    130
    Raises dust and loose paper; small branches are moved.
    Moderate
    5
    30-39
    190
    Small trees in leaf begin to sway; crested wavelets form on inland waters.
    Fresh
    6
    40-50
    250
    Large branches in motion; whistling heard in telephone wires; umbrellas used with difficulty.
    Strong
    7
    51-61
    320
    Whole trees in motion; inconvenience felt walking against the wind.
    Strong
    8
    62-74
    390
    Breaks twigs off trees; generally impedes progress.
    Gale
    9
    75-87
    470
    Slight structural damage.
    Gale
    10
    88-101
    550
    Seldom experienced inland; trees uprooted; considerable structural damage occurs.
    Whole gale
    11
    102-116
    640
    Very rarely experienced inland; accompanied by widespread damage.
    Whole gale
    12
    117 or more
    730+
    Very rarely experienced; accompanied by widespread damage.
    Hurricane

    Based on your findings what was the Wind Speed and the Beaufort Wind Force for each area.


    Spins per minute
    Wind speed ( kph)
    Beaufort Scale
    Field
    8013-20 kph3
    Old J Block site
    6013-20 kph3
    Grass hill
    402-5 kph1
    Tennis Court Gate
    122-5 kph1


    Wind Farm construction

    Tuesday, October 15, 2019

    Definitions | Conservation/Sustainability

    Welcome to another post on my blog. For science, we have to write the definitions some words relating to weather. We had first watched a severe weather video.

    Definitions:
    • Anemometer: Is an instrument which measures the wind.
    • Beaufort wind scale: It is a scale for measuring wind speeds. It is based on observation rather than accurate measurement.
    • Typhoon: Is a tropical cyclone in the Northern Hemisphere. 
    • Monsoon: Is a seasonal wind which lasts for several months.
    • What is it when the weather is really nice and turns to hail? Climate Change


    Image result for anemometer
    Anemometer
    Credit: https://www.madaboutscience.com.au/

    Image result for typhoon
    Typhoon Wutip
    Credit: https://s.w-x.co/wu/wutip-cat5-feb25.jpg

    Image result for monsoon
    Monsoon
    Credit: https://th.thgim.com/news/

    Friday, September 27, 2019

    Decomposing and Recycling | Conservation/Sustainability

    Welcome to another post on my blog. In today's post, I am doing an experiment using Decomosing and Recycling. I hope you like it!

    Aim: To learn about the rate that different materials decompose. 

    Image result for test tube rack


    Hypothesis: I think that the banana is going to be first to rotten.

    Materials:

    1. 4 Test tubes
    2. Test tube rack
    3. Test tube blocker (cork stopper)
    4. Paper  
    5. Banana
    6. Bread
    7. Styrofoam
    8. Water
    Steps:
    1. Get a test tube rack with 4 test tube in it.
    2. Get the four materials, paper, 2-3 small pieces of banana, bread, styrofoam.
    3. Put it in four different test tubes.
    4. If more people are doing this experiment, put the name of your group.
    5. Put the cork stopper on top of the test tube.
    6. Record the information.

    Image:


    Findings:


    TODAY - 27/9/19
    Colour
    Change
    Observations
    Banana
    YellowNo changeAt the half of the test tube.
    Paper
    BrownNo changeThe paper takes up the test tube. 
    Styrofoam cup
    WhiteNo changeStaying at the bottom of the test tube.
    Bread
    BrownNothingAt the half of the test tube.

    • The banana is yellow and there is no change. The banana is at half of the test tube.
    • The paper is brown and there is no change. The paper takes up the test tube.
    • The styrofoam cup is white and there is no change. Staying at the bottom of the test tube.
    • The bread is brown and there is no change. At the half of the test tube.


    3 weeks
    Colour
    Change
    Observations
    Banana
    Brown, black and greenMould and rotting from the top.The mould is growing. Looks soft and disgusting.
    Paper
    BrownNo changeThere is no change.
    Styrofoam cup
    WhiteNo changeThere is no change.
    Bread
    White & BrownSoften downIt is pushed down.

    • After 3 weeks, the banana is brown, black and green. It has mould and it's rotting from the top. The mould is growing. It looks soft and disgusting.
    • After 3 weeks, the paper is brown with no change. 
    • After 3 weeks, the styrofoam cup is white with no change.
    • After 3 weeks, the bread is white and brown which is soften down. The bread is starting to rotten. It is pushed down.

    5 weeks
    Colour
    Change
    Observations
    Banana
    White, Brown, Dark Green and Black.More rotten looks dirty and disgusting.The mould is growing more and more. It looks softer and disgusting.
    Paper
    BrownNo changeThere is no change.
    Styrofoam cup
    WhiteNo changeThere is no change.
    Bread
    BrownSoft like liquidThe bread is soft and it looks like liquid. It is starting to rotten.
      
    • After 5 weeks, the banana is White, Brown, Dark Green and Black. It looks more rotten, looks dirty and disgusting. The mould is growing more and more. It looks softer and disgusting.
    • After 5 weeks, the paper is brown with no change.
    • After 5 weeks, the styrofoam cup is white with no change.
    • After 5 weeks, the bread is brown. It looks soft like liquid. The bread is soft and it looks like liquid. It is starting to rotten.


    Images:

    Week 1 image


    Week 5 image

    Conclusion:

    According to the data and image, the banana has changed the most. It has gone rotten. It was starting to rotten down at week 3 (after the holidays), with a brown, black and green colour. At week 5, the banana had a colour of white, brown, black and green. It was more mouldy and rotten. As seen from the image above, there has been a massive change between the week 1 image and the week 5 image. It is softer and liquidy.

    There has been no change in the paper and styrofoam cup. It looks the same, compared to week 1.

    The bread had some changes. At week 3, the bread was softer and pushed down. It is starting to rotten. At week 5, the bread is softer, pushed down and it looks more liquidy.

    Tuesday, September 24, 2019

    Climate Change Investigation | Conversation/Sustainability

    Welcome to another post on my blog.


    My Investigation on climate change


      DEFINITION: The process of making the ocean acidic.

      What is happening to the oceans?

      The ocean is absorbing carbon dioxide, which is good for us, but not good for the ocean. Because the ocean will turn acidic.

      What does this do to shellfish?

      They do not grow properly and do not grow in the right form/shape. 

      HOW DOES CLIMATE CHANGE CONTRIBUTE TO THE ACIDIFICATION OF OUR OCEANS?


      The carbon dioxide in the atmosphere makes the water in our ocean more acidic.


      2 Images;


      DEFINITION: Action for clearing a wide area of trees
      What are trees used for?

      Trees are used for wood, paper, cardboard, making items from wood, houses, toothpicks, etc.

      HOW DOES DEFORESTATION AFFECT THE CLIMATE?

      Leaves take in carbon dioxide which makes the carbon dioxide in the tree. When they cut the trees, the carbon dioxide escape. 


      2 Images;


      Related image


      Image result for deforestation


      ICE CAP MELTDEFINITION: Ice melting and landing in the ocean
      If all the ice melted what would happen?

      The sea-level rise and islands will sink, floods will increase.

      HOW DOES ICE CAP MELT AFFECT CLIMATE CHANGE?

      Sea Level Rise


      2 Images;

      Image result for ice cap


      Image result for ice cap


      WATER VAPOURDEFINITION: Water Vapour is produced from the evapouration or boiling liquid.
      HOW DOES  WATER VAPOUR AND EVAPORATION CONTRIBUTE TO CLIMATE CHANGE? 


      2 Images;

      Image result for water vapour

      Image result for water vapour