Pages

Showing posts with label 🌍. Show all posts

Sunday, July 26, 2020

Overpopulation, a population problem

Welcome to another post on my blog. In today's post, I am sharing another current environmental problem that we are facing, Overpopulation.


Overpopulation means that the population of a place is too high. Never before history, there have been so many people in Earth right now. Overpopulation can also be for organisms too (animals and plants). But, the term "overpopulation" is mostly used for the number of humans living on Earth.

The population of the planet is reaching unsustainable levels as it faces a scarce of resources (water, food, fuel, etc.). Overpopulation is caused by multiple factors; there was a reduced mortality rate, better medical facilities, reduction of precious resources are a few causes in which overpopulation occurs.

According to Wikipedia“Overpopulation occurs when a species’ population exceeds the carrying capacity of its ecological niche. It can result from an increase in births (fertility rate), a decline in the mortality rate, an increase in immigration, or an unsustainable biome and depletion of resources.”


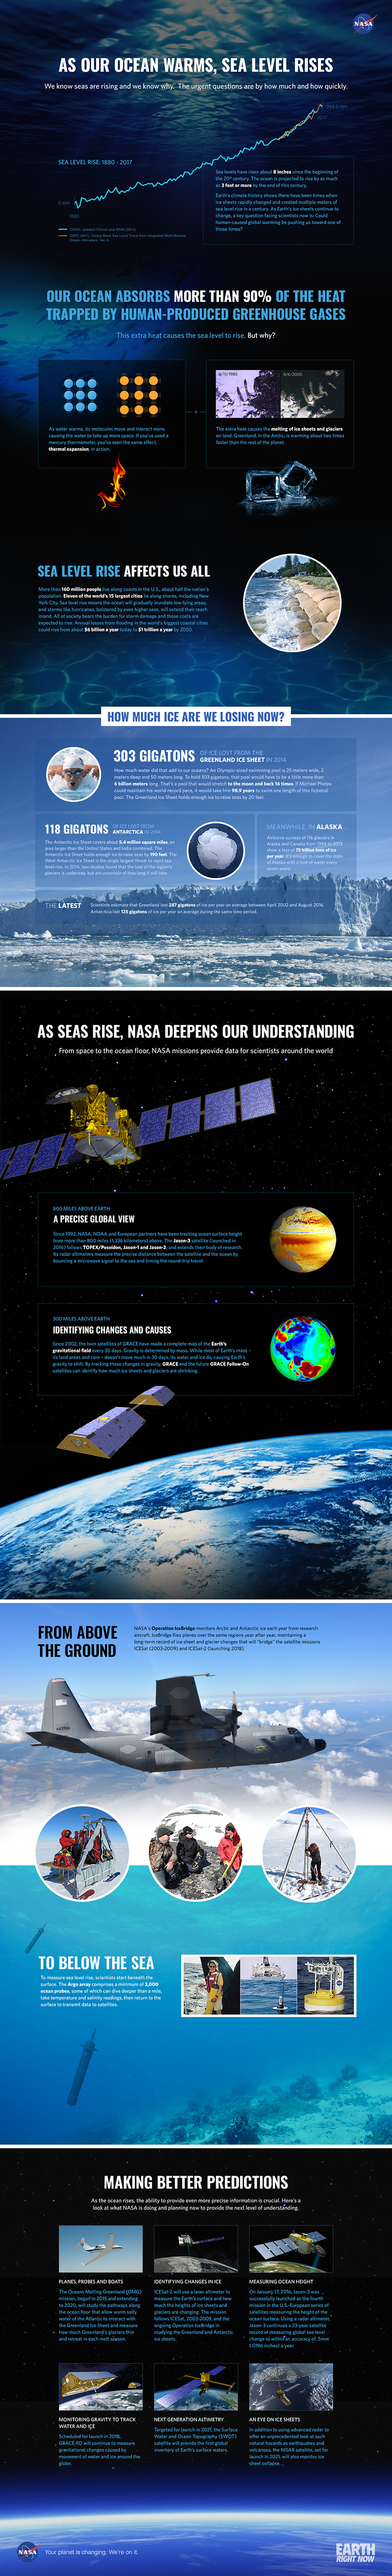
As of 26 July 2020, the world population is estimated at 7.8 billion.


The numbers have shot up, from 1 billion in 1800, 2.3 billion in 1940, 3.7 billion in 1970, and 7.7 billion in 2020.

The world's annual growth rate of the world's population has reached to 2.2% in the 1960s, according to U.S. Census Bureau 2010. At that time, overpopulation was born. It turns out that high birth rates and the population explosion are not permanent features for some countries and cultures, but there was a four-step process the whole world is going through, 'The Demographic Transition'. Most developed countries have already followed the transition, while some countries are working on it right
now.

Back in the 18th century, when the entire world, was in the first stage of the demographic transition.

Natural world population growth, 1950 to 2040
Max Roser / CC BY-SA
Credit: https://ourworldindata.org/grapher/
Most of the world's countries have made it to the fourth stage. Let's look at Bangladesh. In 1971, an average woman had 7 kids, but 25% of them would die before the age of 5. In 2015, the mortality rate had dropped down to 3.8% and women had only 2.2 children on average.

It took developed countries around 80 years to reduce fertility from more than 6 children to less than 3. Some others are catching up fast, Malaysia and South Africa did that in 34 years, Bangladesh just took 20 years, whilst Iran managed it in just only 10 years.

We are getting there, the percentage of people living in extreme poverty has been never been as low as today. So, the future of population growth is not an apocalyptic prediction.

The 2019 forecast from the UN's Population Division shows that the world population growth peaked 2.1% in 1962, then has since dropped to 1.0%, and could further to 0.1% by 2100, a growth rate has not seen after the pre-industrial revolution days.
World Population Growth
Max Roser / CC BY-SA 
Credit: https://ourworldindata.org/world-population-growth

The UN Population Division expects world population, at 7.8 billion (2020), to level out or smooth at/or soon after the end of the 21st century at 10.9 billion (median line).

About 23 of the predicted growth in population between 2020 and 2050 will take place in Africa.

Population growth will come to an end. UN forecasts that the 12th billionth human will never be born. As the development level of the world rises, the number of people a higher education will increase ten times more.


References:


Wednesday, July 15, 2020

Pollution, a current environmental problem

Welcome to another post on my blog. In today's post, I am sharing a current environmental problem that we are facing, Pollution.

Pollution is toxic materials into the environment; these harmful materials are called pollutants. Pollutants can be natural things, such as volcanic ash. Pollution can be also created by human activity, such as factories or trash. Pollutants damage the quality of air, water, and land. Pollution may muddy landscapes, poison soils and waterways, or kill plants and animals.

Light pollution - Wikipedia
Light pollution | Wikipedia
ISS-35, a satellite view of Paris, France at night
Attribution: NASA / Public Domain
Credit: https://commons.wikimedia.org/wiki/

There are many types of pollution; Air, Water, Soil, Light, Noise, Radioactive, Ocean/Marine, Plastic, Thermal, Visual and more; these causes affect our environment in many ways.

What are the methods of reducing noise pollution
Noise Pollution
Credit: https://www.hatkosoundbarrier.com/
One of the deadliest types of pollution is Air Pollution. Air pollution killed approximately seven million people globally every year. According to WHO data, 9 out of 10 people breathe air containing high levels of pollutants. Like air pollution, indoor pollution is another deadly type of pollution which causes diseases and deaths. Smoke from cooking fires causes 3.8 million premature deaths each year, mostly from low and middle-class countries.


Plastic pollution, is pollution which is a concern all around the world, is a type of pollution of plastic objects like plastic bottles, bags, microbeads and more, in the Earth's environment that affects wildlife, their habitat and humans. Plastic pollution threatens ocean health, food safety and quality, human health, coastal tourism, and contributes to climate change.

There are many ways we can make a difference to end or stop plastic pollution.


  1. Use the 3 R's (Reduce, Reuse and Recycle). 
  2. Refuse - Refuse plastic straws. 
  3. Remove - Pick up trash in the neighbourhood and when visiting parks and beaches.
  4. Use reused or reusable bags and pouches.
  5. Try to shop less in bulks.
  6. Not leave any waste on the street, nature or on the beach...
  7. Sort your plastic waste as possible.
  8. Avoid the use of plastic disposable material.
  9. Avoid plastic packaging.
  10. Do not buy water in plastic bottles.
  11. Avoid plastic microbeads in personal care products.
  12. Avoid microplastics.
  13. Be careful with paint.


References:

Wednesday, June 24, 2020

#SolarEclipse2020

View image on Twitter
Alamata, Ethopia #SolarEclipse2020
Credit: https://twitter.com/Landoforigins/status/1274567772471730176/photo/1

An annular solar eclipse occurred on, June 21, 2020. A solar eclipse occurs when the Moon crosses the Earth and the Sun; thereby, partly or totally covering the image of the Sun for an observer on Earth. An annular solar eclipse occurs when the Moon's apparent diameter is smaller than the Sun's, blocking most of the Sun's light and making the Sun look like an annulus (ring). An annular eclipse looks like a particle eclipse over a region of the Earth thousands of kilometres wide.

The eclipse went through central and northeast Africa, Saudi Arabia, Pakistan, northern India, and southern China including Taiwan. But rather than totally blocking the sun, it would leave a "ring of fire" from the sun at the maximum point.

There was an event live stream for people who don't have the eclipse in their country. The eclipse started at 5:45 pm (NZDT).


The eclipse was seen in the northeast of the Republic of Congo at 5:56 am (local time), 4:56 am (GMT), just a few minutes after sunrise.
That was the point of maximum duration, with the blackout lasting 1 minute and 22 seconds.

Going more east across Asia and Africa will reach it's "maximum eclipse", which a perfect solar halo around the Moon, over Uttarakhand, India near the Sino-Indian border at 12:10 local time (6:40 GMT). The alignment of the Earth, Moon and Sun was visible only for 38 seconds. 

For Oman and India, it was the second annular eclipse 6 months after the 26 December 2019 eclipse.

Florent Delefie, an astronomer and the Paris Observatory told AFP, "The annular eclipse is visible from about two percent of Earth surface"
He added, "It's a bit like switching from a 500-watt to a 30-watt light bulb. It's a cold light, and you don't see as well."

File:SE2020Jun21A.gif
Animation of the solar eclipse
Attribution: NASA / Public Domain
Credit: https://commons.wikimedia.org/wiki/File:SE2020Jun21A.gif

Astrophysicist Fred Espenak, an expert on eclipse prediction, commented on the NASA Eclipse website. "Good weather is the key to successful eclipse viewing. Better to see a shorter eclipse from a clear sky than a longer eclipse under clouds."

A solar eclipse always occurs about two weeks before or after a lunar eclipse, when the Moon moves into Earth's shadow. Lunar eclipses are visible from about half of Earth's surface.

There's a second solar eclipse on December 14, 2020, over South America. Because the Moon will be closer to Earth, it will block on the Sun's light entirely.


Sources:

Friday, June 19, 2020

Happy World Environment Day!

Welcome to another post on my blog. At the start of this month (June), in the global pandemic, the world celebrated 'World Environment Day'. It is a day encouraging awareness and action for the protection of the environment. 


World Environment Day is celebrated on 5 June every year in more than 100 countries and is one of the most popular days on the United Nations calendar. It is observed to raised awareness and promotes on environment issues.
World Environment Day 2020 Logo

World Environment Day was hosted by Colombia (in partnership with Germany) this year and the theme was ‘Biodiversity’. Biodiversity gives the basic foundation of preserving life on Earth and human development. Biodiversity explains the quality of life on Earth. It contains the 8 million species on the planet; from plants and animals to fungi and bacteria - the ecosystems that house them; and the genetic diversity between them.


Since 1974, this has been celebrated every year on 5 June: attracting governments, businesses, celebrities and citizens to concentrate their efforts on an important environmental issue.


World Environment Day was founded by the United Nations General Assembly in 1972 on the first day of the Stockholm Conference on the Human Environment, rising from discussions on the integration of human interactions and the environment. Two years later, in 1974, the first World Environment Day was held in Stockholm, Sweden with the theme “Only One Earth”.


If you want to know more about World Environment Day, here is the official website.


References:


Friday, April 10, 2020

Earth Stops Shaking Due To COVID-19, Scientists Say

Welcome to another post on my blog. In today's post, we are looking at Earth shaking less after coronavirus. For more information, read this article.


Now, crowded city streets are now empty. Highway traffic has slowed to a minimum, fewer and fewer people are found outside. Around four billion people (approx half the world’s population) have been told to isolate themselves in their homes to prevent the spread of coronavirus. The significant reduction in the hum of normal human activity has lead to a surprising shift in Earth’s vibrations. The lack of noise means “Earth’s upper crust is moving just a little less,” according to CNN.

Scientists tell that coronavirus lockdowns around the world are making the Earth move less. Since people in many countries are stuck from leaving their homes, factories and traffic ground to a stop, seismic noise, hum of vibrations in the planet’s crust have dropped. The researchers told The Independent the change will not only make it easier to detect earthquake signals, but also provide a lesson for the environment. The vibrations from cars, trains, buses, factories and people going about their daily life to create background noise (noise pollution) that make Earth’s crust move. 

Residents of Brussels have been told to stay at home, leaving the city’s streets empty. Credit: Jonathan Raa/NurPhoto via Getty

Thomas Lecocq, a geologist and seismologist at the Roya Observatory in Belgium first pointed out this miracle in Brussels. Brussels is seeing about a 30% to 50% reduction in ambient seismic noise since mid-March, around the time the country started implementing school, business closures and other distancing measures, according to Lecocq. He discovered that about one-third of vibrations have decreased because of social distancing and quarantine restrictions, according to CBS News. That noise level is equal with what seismologists (the scientific study of earthquakes) would see on Christmas Day, he stated. Since quarantine measures were introduced, the surface seismometer at the Royal Observatory of Belgium has become more sensitive to quieter seismic activity that it would have earlier missed, which could lead to more precise measurements of small quakes, quarry blasts, storms and crashing ocean waves. The reduction in noise has provided scientists with a small profit - seismic detection equipment is now more sensitive, Thomas explained to Nature. With an overall quieter planet, seismologists around the globe can anticipate enhanced abilities in instruments that detect the locations of earthquakes and aftershocks. 

Source: Royal Observatory of Belgium


Lecocq said, “This is really getting quiet now in Belgium”. 

Dr Lecocq told The Independent that the capacity of noisy stations those affected by human-generated vibrations to detect smaller earthquake signals was larger since the coronavirus lockdown. 

But the findings are also sociological, he said: “Every individual thinks he is ‘alone at home’, but all together, we are making something big for the ‘seismic environment’ – and we can probably learn a lesson here for other parts of the environment. 

“The reason we are home is terrifying, but in the future, maybe, some critical number of individuals will change their ways, avoiding single-occupancy car-commuting.” Dr Lecocq said there was no proof that the fall in human activity would create earthquakes less expected.

Update for Brussels. The background level remains low and stable (~33%).


In February, news articles were published when space images showed a huge fall in pollution over China as factories close. Studies show that it had cut 40% during the lockdown in China.

 “By combining satellite observations with detailed computer models of the atmosphere, their studies indicated a reduction of around 20-30 percent in surface particulate matter over large parts of China,” ESA reported Friday.


Pollution levels in January contrast with those in February

Air pollution causes an estimated 1.1 million deaths every year in China and costs the Chinese economy $38 billion USD. Earlier last month, Stanford Earth Sciences Professor Marshall Burke projected two months of coronavirus lockdown had saved the lives of 77,000 Chinese children and elderly from air pollution alone. Worldwide, air pollution kills around 7 million people annually, including 100,000 Americans. 

Fei Liu, an air quality researcher at NASA’s Goddard Space Flight Centre said, “This is the first time I have seen such a dramatic drop-off over such a wide area for a specific event”. She said she had seen a drop in nitrogen dioxide levels during the economic collapse of 2008 but she said that decrease more regular.

This year, pollution levels did not rise again after Chinese new year, unlike last year


The number of coronavirus cases worldwide continues to skyrocket, with over 1.5 million confirmed positive cases and over 89,000 deaths as of Friday 10 April. 


References:

Friday, December 6, 2019

Book Review

What's Really Happening To Our Planet?
Credit: https://www.tonyjuniper.com/content/whats-really-happening-our-planet-0
Welcome to another post on my blog. In today's post, I am going to share my thoughts and ideas of a book I have. This book is written by Tony Juniper, and it is named, 'What's Really Happening To Our Planet?'. Tony Juniper has been sharing information about the dramatic changes that have been happening on Earth. In this video, you can hear some of the numbers that can help you understand the changes that are going on today.


10 Quick Facts About Climate Change from Tony Juniper

  1. Since 1950, the world’s population has tripled
  2. The number of cities with a population of over 10 million people was: one in 1950, ten in 1990, and is twenty-eight today
  3. Global energy demand is expected to double by 2030 compared to 1990 (with most new capacity coming from renewable sources)
  4. Only about 1/4 of the planet’s agricultural land is being used to grow crops, the rest is being used to raise animals
  5. About 97.5% of the planet’s total water resources are saltwater, about 0.3% is liquid water at the surface, the rest is locked in groundwater and ice caps
  6. Since 1900, the consumption of construction materials, metals, ores, fossil fuels and biomass has increased tenfold
  7. Carbon dioxide concentrations in the planet’s atmosphere are higher now than at any point in at least the last 800,000 years
  8. Ten thousand years ago, 99.9% of vertebrate biomass was composed of wild animals; today, 96% of vertebrate biomass is made up of people and their domesticated animals
  9. The rate of animal and plant extinction taking place on the planet today is approaching a rate not seen on earth for 65 million years
  10. Since 1962, the area of protected habitat on the planet, in the form of national parks and nature reserves, has increased fourteenfold, to reach more than 33 million square kilometres

Tuesday, July 30, 2019

Supercontinents

Image result for supercontinents
History of Supercontinents
Credit: https://cdn-images-1.medium.com/max/1600/1*zMHdb8IeaNiDaSJ4DO8Zug.gif

Welcome to another post about continents. Last post, I discussed about a hidden continent, Zealandia. To want more information, click here. I had posted a post about supercontinents in my Geology science badge, for more information, click here. Let's go back to the topic. I am going to talk about two supercontinents which were on this planet.


Vaalbara between 3.6-2.8 billion years ago

The first known supercontinent is Vaalbara. There is evidence of the first cratons in South Africa and Western Australia. The crust from Vaalbara is back 3.6 to 2.8 billion years ago. Vaalbara's name comes from two cratons which were believed to be combined about 3.1 billion years ago. The first craton which now is in South Africa named Kaapvaal Craton. The second craton is the Pilbara craton which is in PilbaraWest Australia. Approximately 2.5 billion years ago the supercontinent split apart from each other. Their drift routes present additional evidence that they were once connected.

Pangaea between 0.335 - 0.173 billion years ago

Around 300 million years ago, Earth hadn't had the seven continents that we have now, but instead, there was one massive supercontinent, Pangaea. Pangaea was the most recent supercontinent. Alfred Wegener convinced that Earth's continents were once part of a supercontinent, Pangaea. Alfred trained as an astronomer, used botanybiology and geology to explain Pangaea and the continental drift. One example is fossils of the ancient reptile mesosaurus that are only found in South America and southern Africa. Mesosaurus is a reptile that is freshwater and it is just only one metre long, the reptile couldn't have swum the Atlantic Ocean.


Here is a video from Khan Academy explaining about Pangaea.


Here is another video from Marilyn Adams about the expanding earth.


I hope you like my post about supercontinents. Comment down below if you know about supercontinents. Have a cool day!! Bye!!

Monday, May 6, 2019

Climate Change - Our Biggest Challenge

For reading, we are reading about Climate Change. The teacher had set activities for us to know about climate change. After we've finished, we had to make an infographic or a DLO about the topic.

Definition:

According to Google Definition, climate change means - a change in global or regional climate patterns, in particular a change apparent from the mid to late 20th century onwards and attributed largely to the increased levels of atmospheric carbon dioxide produced by the use of fossil fuels.


Here's my infographic that I've made.


I hope you like my post about Climate Change. I hope you learnt something new from this infographic. Comment down below what you've learnt today about Climate Change. Have a cool day!! Bye!!

Saturday, November 24, 2018

The Sea Highers its Level

For today's post, we are going to look at Sea level. If you haven't seen my last post, 'What are they?', please check it out. In my Geology badge, I had referred about the sea level in my 'Earth's Records' post. I had told you that Mount Everest is the tallest mountain in altitude. Manua Kea is shorter in altitude, but including the sea level, Manua Kea is above 10,000 meters tall. But this is different of what I'm going to talk to you today.

What is Sea Level Rise caused by?

One of the reasons for sea level rise is rising because of glaciers and ice sheets. Second, it is caused by thermal expansion caused by warming up the ocean. The ocean has absorbed more than 90% because of the atmospheric heat connected with emissions from human activity. When the sea gets warmer, places with ice like Antarctica and the Arctic, the ice melts and water starts to come in the ocean.


Facts from the video


  • Earth absorbs for than 90% of the heat from global warming.
  • A child born today can expect the ocean to rise between 30 centimetres and 1.2 meters in their lifetime.
  • Only in the United States, nearly 5 million people live near within 1.2 meters of the local high tide level. That could mean increased flooding from storm surges.
  • As the ocean rises, the salt water (water from the sea) can get mixed with rivers and groundwater. Which people can get fresh water for drinking and farming.


Here are a few videos about the sea level rise. The first one is about the contributors to the sea-level rise | European Space Agency (ESA) and Sea level rise accelerates over time | NASA Climate Change

In the first video, it shows places where sea level is rising and a data graph of the sea level rise.


Now, this is a video about sea level rise, rising over time.


Let's have some fun! I've got a quiz from NASA Climate Change, about Sea Level Rise.


Infographic: Sea level rise
This is a small (but big)
infographic from
NASA Climate Change
which shows data, facts,
information and more.
Credit: https://climate.nasa.gov/

If it didn't work, go on the quiz link.

How was your quiz? Did you get more than 6 correct answers? If you did, "congratulations"! Now, this is the end of my post. Before that, I'll tell you what I've learnt.


What I've learnt

  • One of the reasons for sea level rise is rising because of glaciers and ice sheets.
  • It is caused by thermal expansion caused by warming up the ocean.
  • The ocean has absorbed more than 90% because of the atmospheric heat connected with emissions from human activity.
  • When the sea gets warmer, places with ice like Antarctica and the Arctic, the ice melts and water starts to come in the ocean.
  • Earth absorbs for than 90% of the heat from global warming.
  • A child born today can expect the ocean to rise between 30 centimetres and 1.2 meters in their lifetime.
  • Only in the United States, nearly 5 million people live near within 1.2 meters of the local high tide level. That could mean increased flooding from storm surges.
  • As the ocean rises, the salt water (water from the sea) can get mixed with rivers and groundwater. Which people can get fresh water for drinking and farming.
I hope you like my post about Sea Level Rise. Comment down below if you have learnt something new. Have a cool day!! Bye!!

Thursday, November 15, 2018

World or Plastic?

Image result for how humans are turning the world into plasticFor today's post, we are going to look at a part in ocean pollution which is ruining the ocean and making it polluted, plastic. This pollution is called Plastic pollution, which includes plastic bottles, plastic bags and more. This topic refers to two posts that I've posted, How many are there?, and It's the Sea of Garbage!!. Because it shows how polluted our oceans are. There is more plastic in the ocean than any other item. Life without plastic is impossible, right? Plastic has been a problem and we should know about the dangers. This is a video from UN Environment (United Nations Environment Programme) and Clean Seas campaign.


Data


Facts


  • It is estimated that we've produced around 300 million tons of plastic each year.
  • There is 9% which is recycled, 12% which is burned and 79% which is wandering in our ocean.
  • According to the recent studies from Worldwatch Institute, it is estimated that there is 268,940 tons of plastic are currently floating in the world’s oceans.


What I've Learnt?

  • The global/world production has been increasing since 1950.
  • Most of the plastic is used for packaging.
  • It is estimated that we've produced around 300 million tons of plastic each year.
  • There is 9% which is recycled, 12% which is burned and 79% which is wandering in our ocean.
  • According to the recent studies from Worldwatch Institute, it is estimated that there is 268,940 tons of plastic are currently floating in the world’s oceans.
I hope you like my post. Comment down below if you've learnt something new. Have a cool day!! Bye!!

Sunday, November 4, 2018

Why Deforestation?

For today's post, we are going to look at a topic where there is a limit of, trees. We all know that there are many trees chopped off every day.


Deforestation in Brazil
Credithttps://www.livescience.com/
According to Quora, there are about 100 trees cut down every minute!! Every day, nearly 100,000 acres is chopped down every day. Around 15,000,000,000 trees are cut down every year.

Around 31% of Earth's land area is the forest. Forests give required oxygen and provide homes for the wildlife also people. Most of the endangered animals (giant panda, tiger, gorilla, mountain gorilla, Amur leopard, Asian elephants, Tasmanian devil and orangutans) live in forests, these forests include fresh water, food, traditional medicines, clothing and shelter.


Image result for deforestation
Deforestation
Credithttps://www.livescience.com/
Deforestation can happen in many forms, fire, for agriculture, land for development for houses and urbanization, to create ingredients which are popular like, oil and palm oil.

Deforestation is one of the reasons for climate change. Here are a few videos from National Geographic, WWF and CNN. These videos explain what happens to deforestation and facts about deforestation. Hope you like these videos. 


Stats - New Zealand
Credit: https://www.globalforestwatch.org/


>

Land Cover


Forest Change


What I've Learnt

  • According to Quora, there are about 100 trees cut down every minute!! Every day, nearly 100,000 acres is chopped down every day. Around 15,000,000,000 trees are cut down every year.
  • Around 31% of Earth's land area is the forest.
  • Forests give required oxygen and provide homes for the wildlife also people.
  • Most of the endangered animals (giant panda, tiger, gorilla, mountain gorilla, Amur leopard, Asian elephants, Tasmanian devil and orangutans) live in forests, these forests include fresh water, food, traditional medicines, clothing and shelter.
  • Deforestation can happen in many forms, fire, for agriculture, land for development for houses and urbanization, to create ingredients which are popular like, oil and palm oil.
  • Information from National Geographic, WWF and CNN.
  • Information from Global Forest Watch.
I hope you like your post about Deforestation. Comment down below if you've learnt something new. Have a cool day!! Bye!!

WE NEED TO STOP DEFORESTATION!

Friday, November 2, 2018

It's the Sea of Garbage!!

My Drawing of Plastic bottles in the sea
For today's post, we are going to look at the Sea of Garbage. There have been people littering and rubbish going in the sea. This powtoon shows what happens if plastic bottles have been recycled, about the garbage patch, what happens to sea turtles, and more. Here's the powtoon.


What I've learnt


  • What happens to sea turtles in the ocean.
  • Learning about the Great Pacific Garbage Patch.
  • What happens to plastic bottles when they are recycled. 

I hope you like my post about the Sea of Garbage. Have a cool day!! Bye!!

Thursday, October 25, 2018

Why is Earth's Temperature Increasing?

What’s in a name? Weather, global warming and climate change

For today's post, we are going to look at Earth's temperature. If you haven't seen my last post, 'The Three R's' check it out! If you don't know, I have started my new science badge, Environmental Science. I've chosen to post about this topic because we need people to know why our temperature is changing and we need to stop it. This is why our temperature is changing.

One of the reasons Earth's temperature is increasing is because of Pollution. I've made a blog post about Air Pollution and what it does. Here's a preview of the blog post.

You have heard of the word 'Pollution', but do you know what is air pollution. Well, the word 'Pollution' means, effects that harm our environment. Air Pollution means Pollution in the air. Air Pollution is one of the reasons our climate is changing.

Read more...


Carbon Dioxide's Affect


Carbon Dioxide (CO2) is a colourless gas. Carbon Dioxide is released by natural processes like volcano eruptions, human activities like deforestation, burning fossil fuels. Humans have increased have CO2 in the atmosphere by more than a third since Industrial Revolution began. The latest measurement of Carbon Dioxide is 409 ppm (parts per million) in September 2018 (last month). As you see the image below the Carbon Dioxide has increased since the 1950 level.

This graph, based on the comparison of atmospheric samples contained in ice cores and more recent direct  measurements, provides evidence that atmospheric CO2 has increased  since the Industrial Revolution.  (Source: [[LINK||http://www.ncdc.noaa.gov/paleo/icecore/||NOAA]])
Here is an image about the Carbon Dioxide increasing since 1950.
Credit: https://climate.nasa.gov/evidence/
Image about Carbon Dioxide increasing - From 2015 to present
Credit: https://climate.nasa.gov/vital-signs/carbon-dioxide/


How Many Degrees has it Increased?

After learning about Carbon Dioxide and what it does to Earth, let's know how hot is Earth? According to Goddard Institute for Space Studies (GISS), on average, every year, Earth has increased 0.8° since 1880. The warmest year on record is 2016. On the right is an image which shows you the temperature anomaly (long-term average). Below the image, there is a video about the global temperature anomalies it's from 1880-2017. This video is from NASA Climate Change.


As you see in the video, the Carbon Dioxide has mostly increased in the Northern Hemisphere. Temperature has also increased in cold places like Antarctica and Greenland. Below are two videos of ice loss in the Antarctic and Greenland.


Here is a video from NASA Climate Change about Greenland's ice sheet and how it is changing. There are missions studying Greenland: Operation IceBridgeGRACE (Gravity Recovery and Climate Experiment), ICESat 2 (future) and Oceans Melting Greenland (OMG).


What I've Learnt


  • Carbon Dioxide (CO2) is a colourless gas.
  • Carbon Dioxide is released by natural processes like volcano eruptions, human activities like deforestation, burning fossil fuels.
  • Humans have increased have CO2 in the atmosphere by more than a third since Industrial Revolution began.
  • The carbon dioxide last month was 409 ppm. 
  • ppm means 'Parts per million'.
  • The carbon dioxide has increased so much from 1950.
  • Earth has increased by 0.8° since 1880.
  • The warmest year on record is 2016.
  • Carbon Dioxide has increased so much in the Northern Hemisphere.
  • Every year the average mass of loss is 125 gigaton/year in Antarctica.
  • Every year the average mass of loss is 281 gigaton/year in Greenland.


I hope you like my post about 'Why is Earth's Temperature Increasing?'. Comment down below if you've learnt something new. Have a cool day!! Bye!!